Workflows per repository
On the homepage of the overview, you’ll find all of your workflows. They are grouped by repository, and show the status of recent runs as well as the duration of these workflows over time.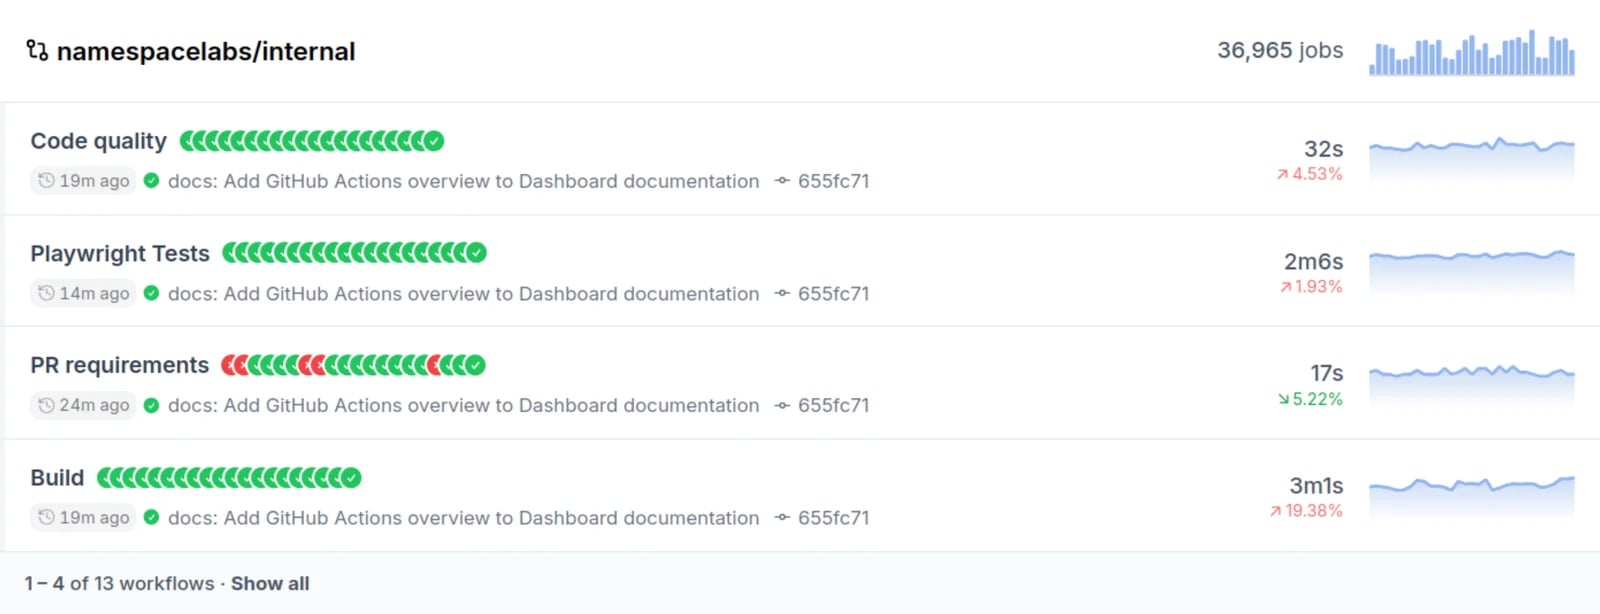
Workflow
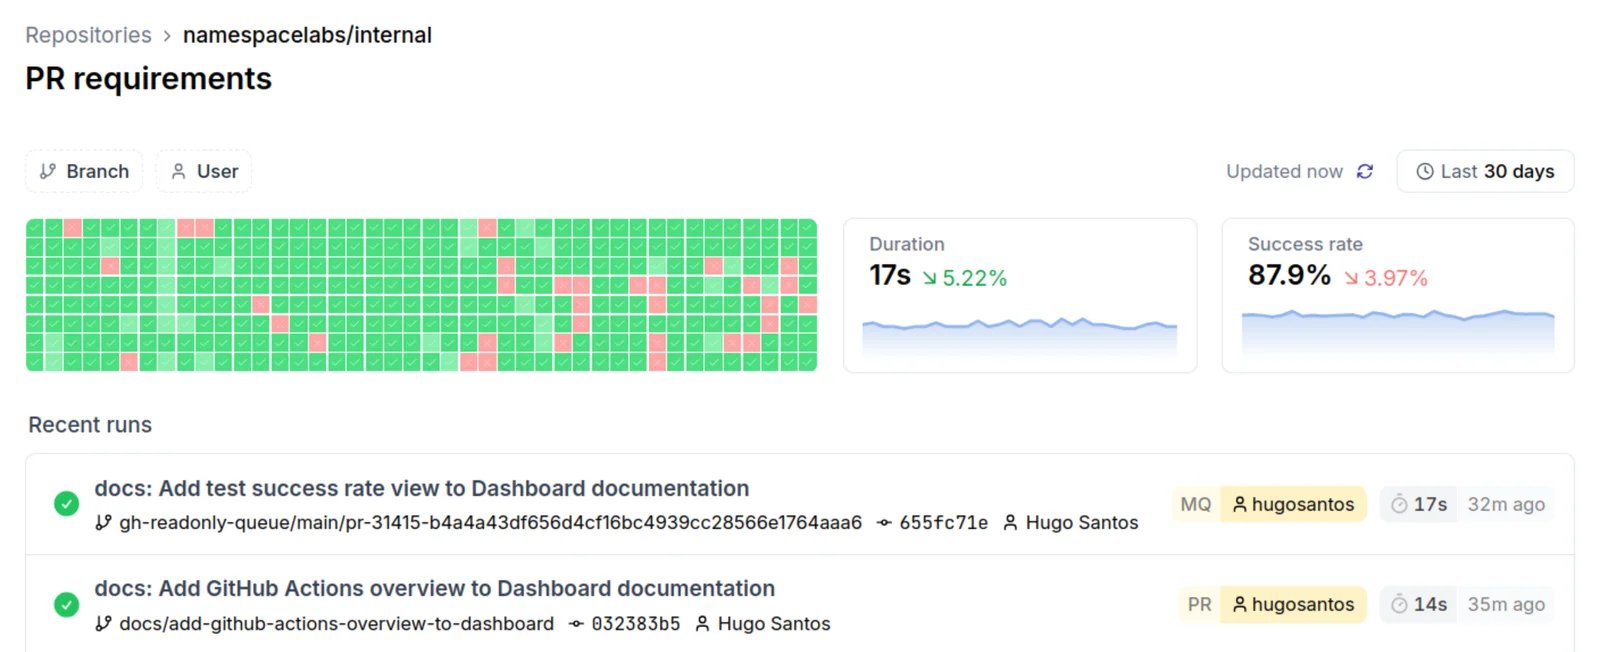
On top of the Workflow page, a few graphs give a quick impression of the health of this workflow.- The grid of checkmarks shows runs and whether they succeeded or not, this allows you to quickly spot flakiness or find what commit caused it to fail.
- The duration graph shows the duration of the last job, and the progression over time. This is useful to spot performance regressions and possible optimizations.
- The success rate is another important indicator of the healthiness of a workflow, showing you if reliability has changed.
Workflow Jobs
The Workflows Jobs page shows you information about the commit or action that triggered this job, and it shows all individual jobs that ran. In the trace, you can see how long each job took and which jobs depend on each other. This allows you to quickly identify the critical paths where performance improvements will be most impactful.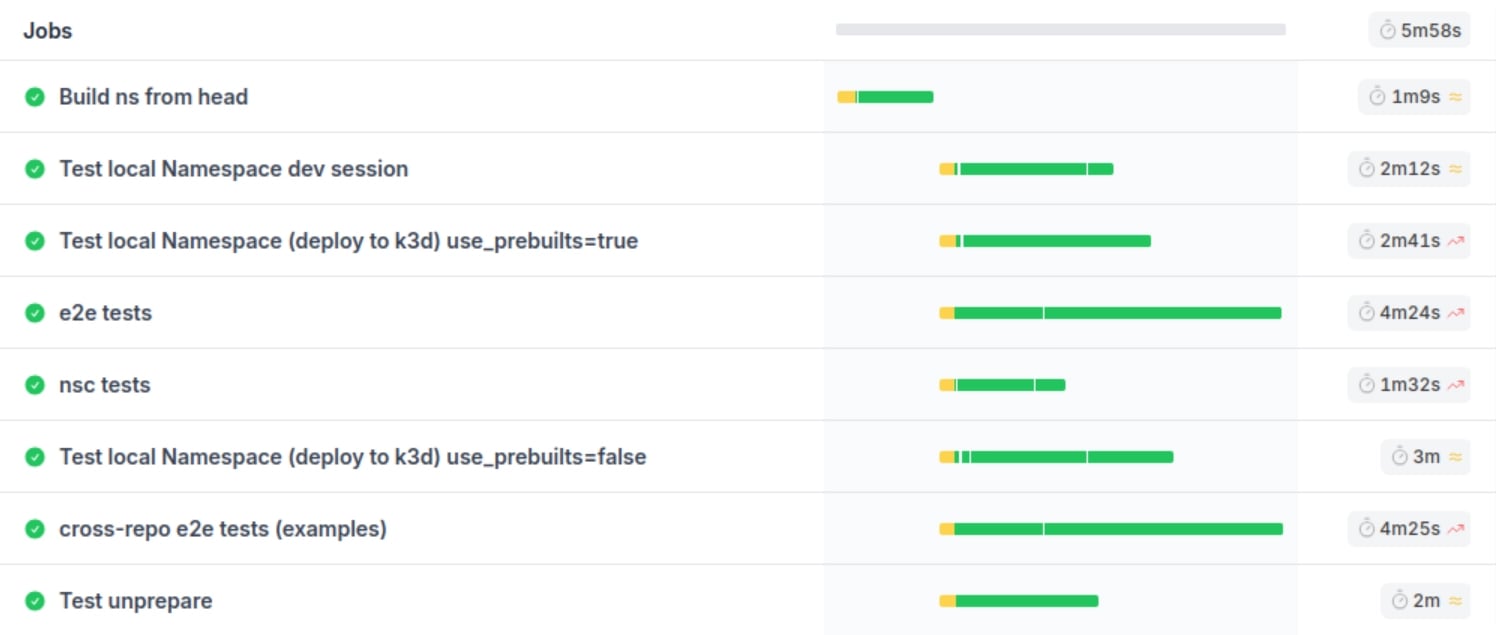
Job view
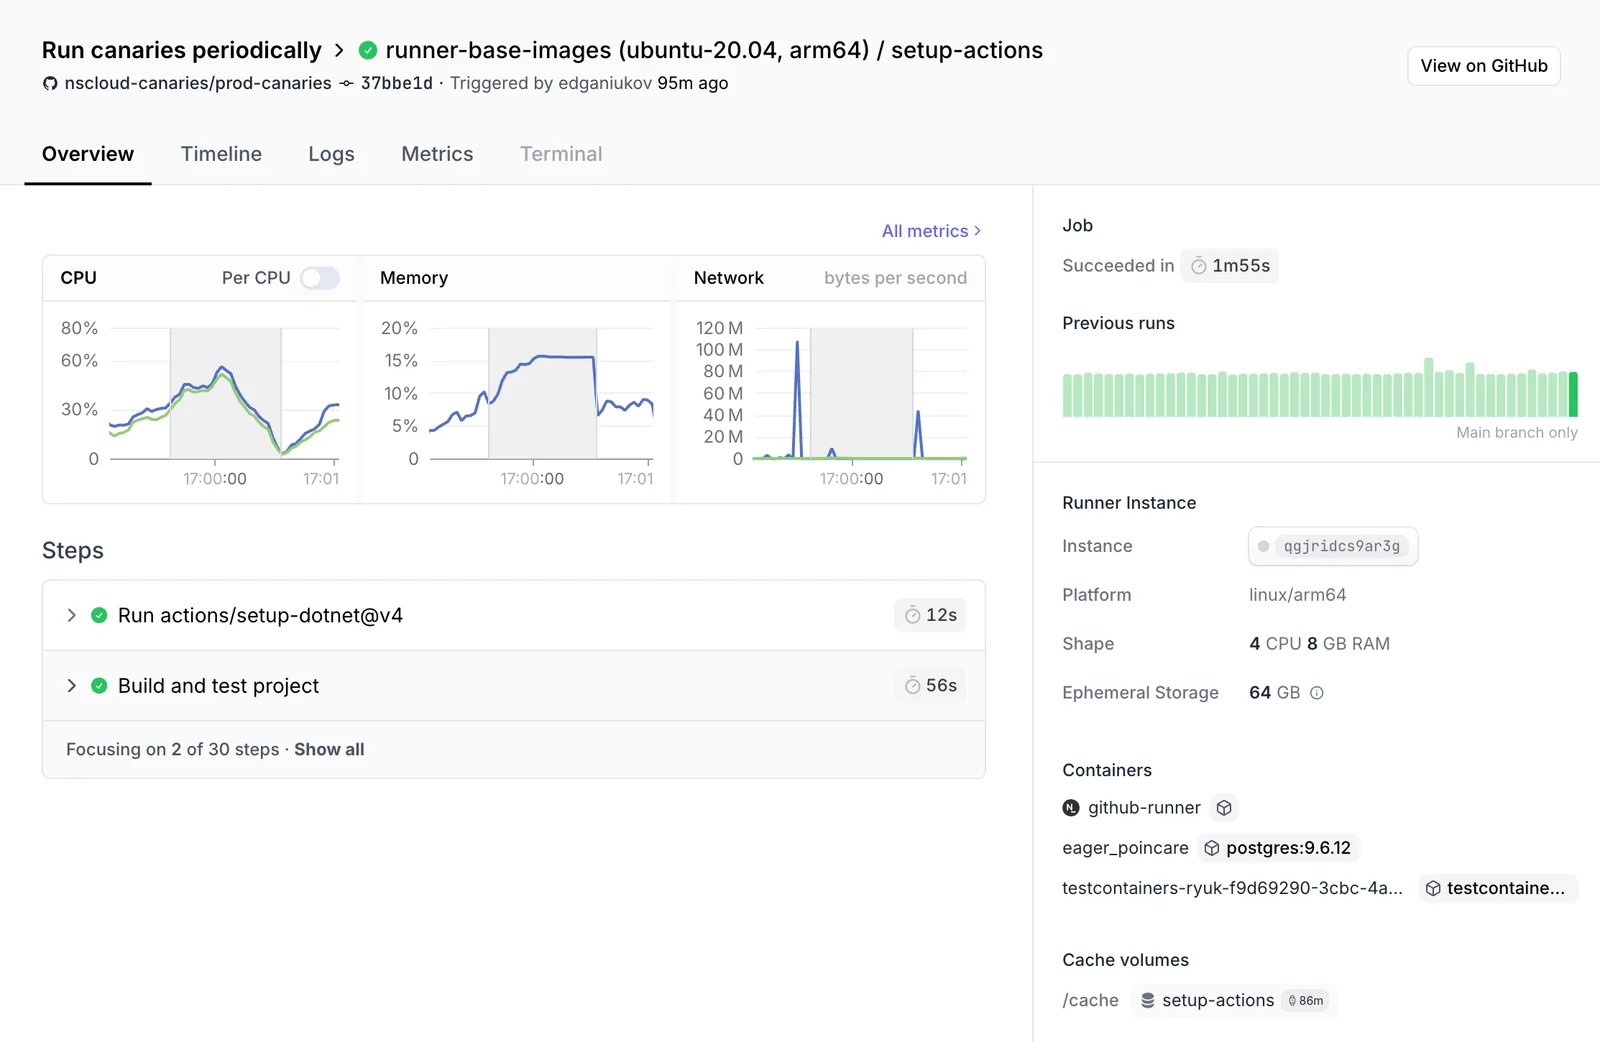
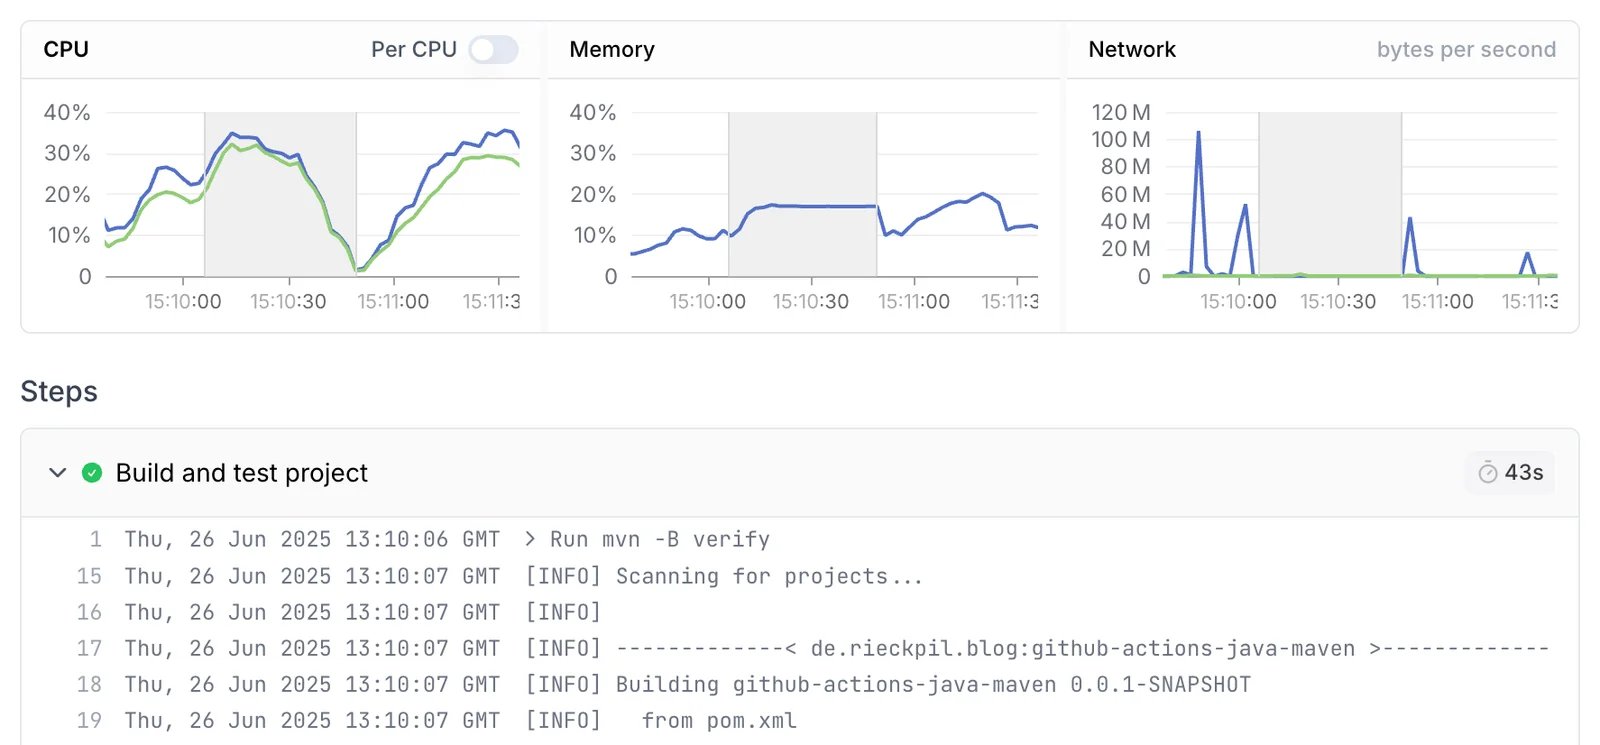
The dedicated job view allows correlating job steps with performance metrics and comparing a job’s performance to previous runs. This visibility helps you identify performance bottlenecks and track improvements over time. More information about how you can use this view to Debug GitHub Actions