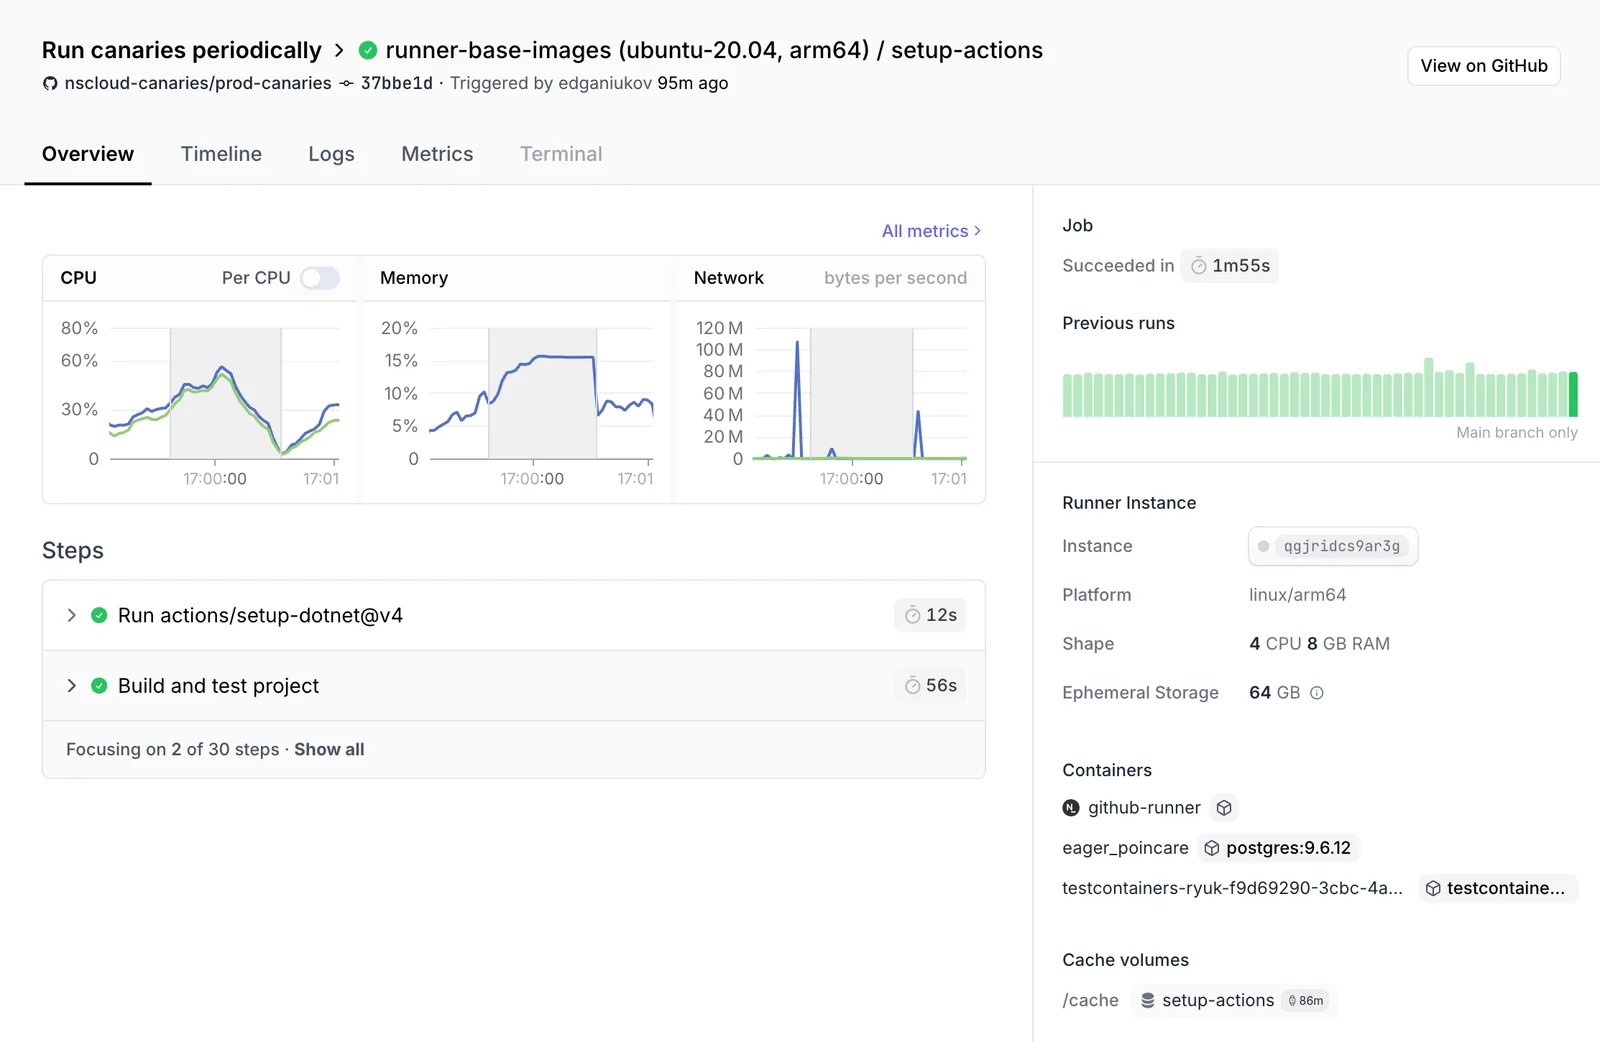
To find these metrics, open the GitHub Actions dashboard, select a repository’s workflow, open a run, and click a job to open its job view. The dedicated job view allows correlating job steps with performance metrics and comparing a job’s performance to previous runs. This visibility helps you identify performance bottlenecks and track improvements over time.
  • CPU Usage: Track processor utilization across all cores, identify CPU-intensive operations
  • Memory Consumption: Detect memory leaks and excessive allocation
  • Disk I/O: Understand disk read/write patterns, identify storage bottlenecks
  • Network Activity: Track network usage, bandwidth consumption, and connection patterns
The previous runs panel allows you to compare the performance of the current run to the recent history of this job.

Next steps

Last modified on September 15, 2026