Bazel observability

Inspect what happened during a Bazel invocation, from the dashboard or the CLI.

Namespace records the Bazel invocations that pass through its remote cache and remote execution service. Each invocation can be inspected afterwards, whether it used caching alone or also ran actions on remote workers.

Invocations in the dashboard

The Bazel invocations page lists recent invocations for your workspace.
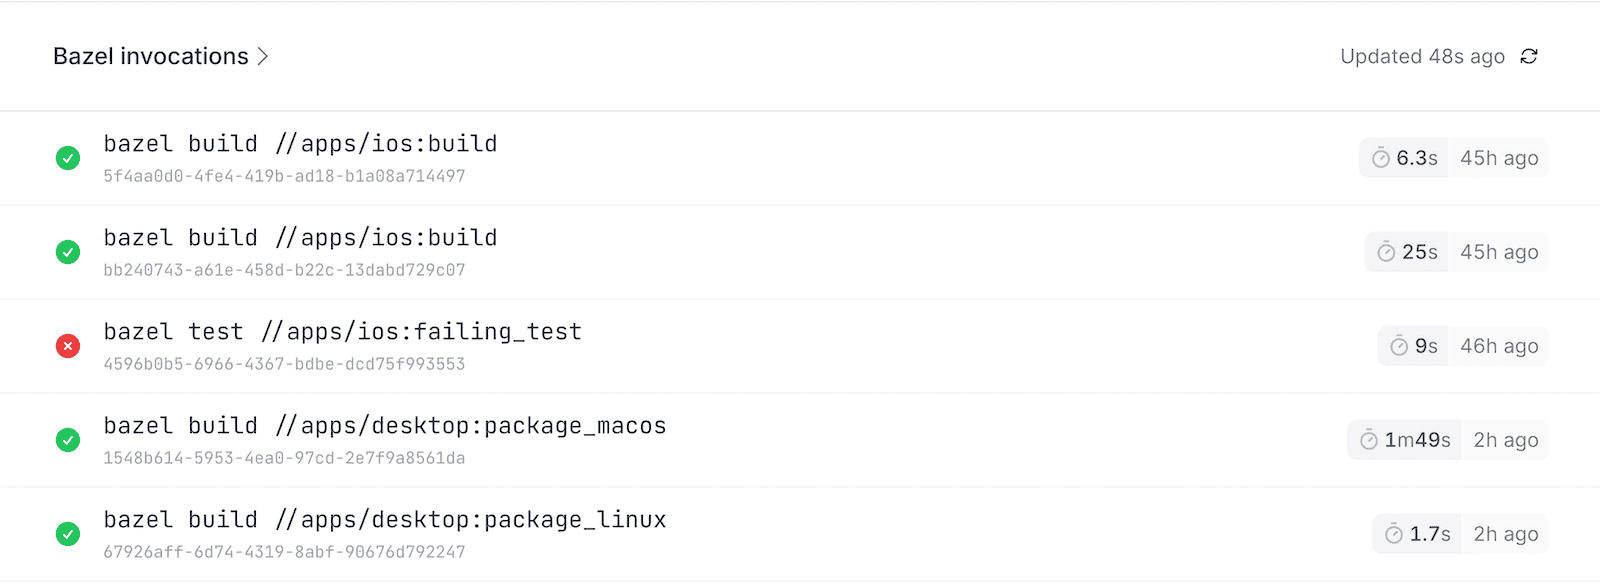
Bazel invocations list in the Namespace dashboard

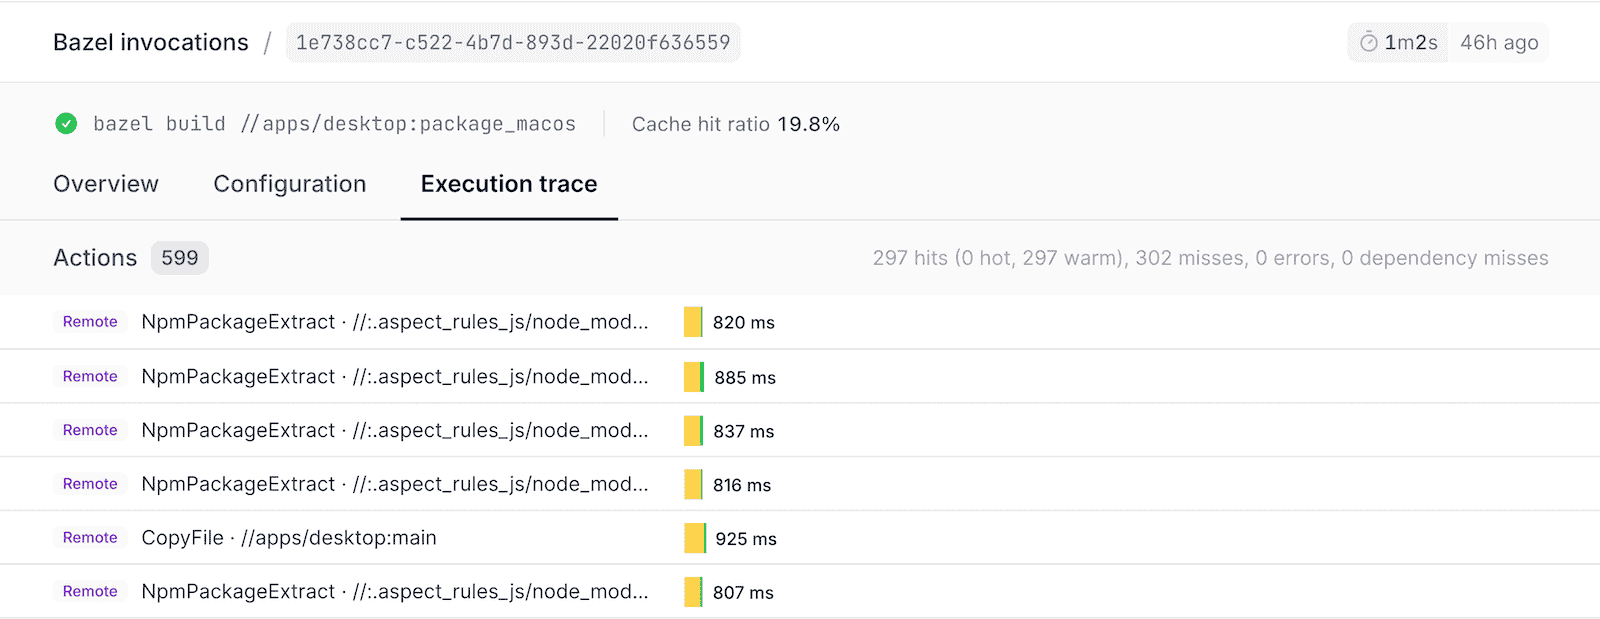
Select one to see its details.

Bazel invocations details in the Namespace dashboard

Invocations from the CLI

The observability CLI commands require nsc v0.0.546 or later. Run nsc version ensure --at_least 0.0.546 to check and update the CLI if needed.

List recent invocations

List the most recent invocations with:

$
nsc bazel invocation list

Each row includes the invocation id you need to retrieve a report.

┌──────────────────────────────────────────────────────────────┐
│ Invocation ID                         Started     Completed  │
│──────────────────────────────────────────────────────────────│
│ 5f4aa0d0-4fe4-419b-ad18-b1a08a714497  1 day ago   1 day ago  │
│ bb240743-a61e-458d-b22c-13dabd729c07  1 day ago   1 day ago  │
...

Narrow the results

Use --since to narrow the list to a time window, and --max_entries to control how many rows come back:

$
nsc bazel invocation list --since 24h --max_entries 5

List invocations for scripts and agents

When scripting or driving the command from an agent, pass --output json to get machine-readable output:

$
nsc bazel invocation list --output json --max_entries 5

Pull a report

Stream a report for a single invocation with:

$
nsc bazel invocation report <invocation-id>

Redirect it to a file so you can inspect it or hand it to an agent for analysis:

$
nsc bazel invocation report <invocation-id> > report.json

What a report contains

A report is newline-delimited JSON, one record per line: metadata, configurations, metrics, build_tool_logs, and targets, plus fetches and actions when the invocation fetched or executed anything. On larger builds actions is split across several records rather than one.

Much of that is what Bazel already knows: action counts, timing per phase, the critical path, targets and their outputs. The part Bazel does not have is in actions, where every remotely executed action records whether it hit the cache, which worker ran it, how long it queued, and how its time split between hydration, execution, and output upload.

Reports scale with the invocation. A one-action `bazel run` might produce a few kilobytes, while a 1500-action build can produce over 400 KB. Slice out what you need before handing a large one to something with a limited context window:

$
jq 'select(.metrics) | .metrics.timing_metrics' report.json

Debugging failed builds

When a failure is in your code or your build definition, Bazel's own output is usually enough. A compile error or a failing test assertion points at itself.

Reports are for the failures Bazel cannot explain. Resource limits, configuration constraints, and images that fail to start all reach Bazel as an opaque failure. So does a test that depends on the environment, such as one that starts a database in a container, where the reason may only appear in that container's output. Reports carry the surrounding detail, including which worker ran each action, so a failure can be traced back to the machine it ran on.

That detail is spread across a lot of records, which makes it a good candidate for handing to an agent rather than reading yourself.

Analyzing a report with an agent

Reports are built for machine consumption. They carry most of what was observed during an invocation, which is more than is practical to read line by line, so handing one to an agent is often faster than reading it yourself.

Analyze a slow build

Save a report and point an agent at it:

$
nsc bazel invocation report <invocation-id> > report.json
Agent Prompt
Read report.json, a Namespace Bazel invocation report in newline-delimited JSON, one record per line. Work out why this build was slow. Start with metrics.timing_metrics for the phase breakdown and metrics.runner_count for how much was cache hits, remote execution, and internal work. Read the critical path entry in build_tool_logs, which attributes time to queue, network, upload, setup, and process. Then use the actions records, which may span several lines, to find the slowest actions and check their scheduler_queue_ms, worker_queue_ms, and timing breakdown. Tell me the three changes most likely to reduce wall-clock time, and quote the evidence for each.

Analyze a failed build

The same approach works for a failure rather than a slow build:

Agent Prompt
Read report.json, a Namespace Bazel invocation report in newline-delimited JSON, one record per line. The build failed. Establish whether the cause was in the build itself or in the environment it ran in. Check metadata.result and the attempts list, then look for actions that failed and whether they ran remotely. If they did, note which worker ran them and whether several failures share a worker. Quote the records that support your conclusion.

Reports describe your build rather than containing your source, but they do include target labels, workspace identifiers, host and user names, and your repository's structure. Treat one as you would any other build log before sending it to a third-party service.

Last updated